Free Download · Excel & Google Sheets
Forecasts that respect your seasons.
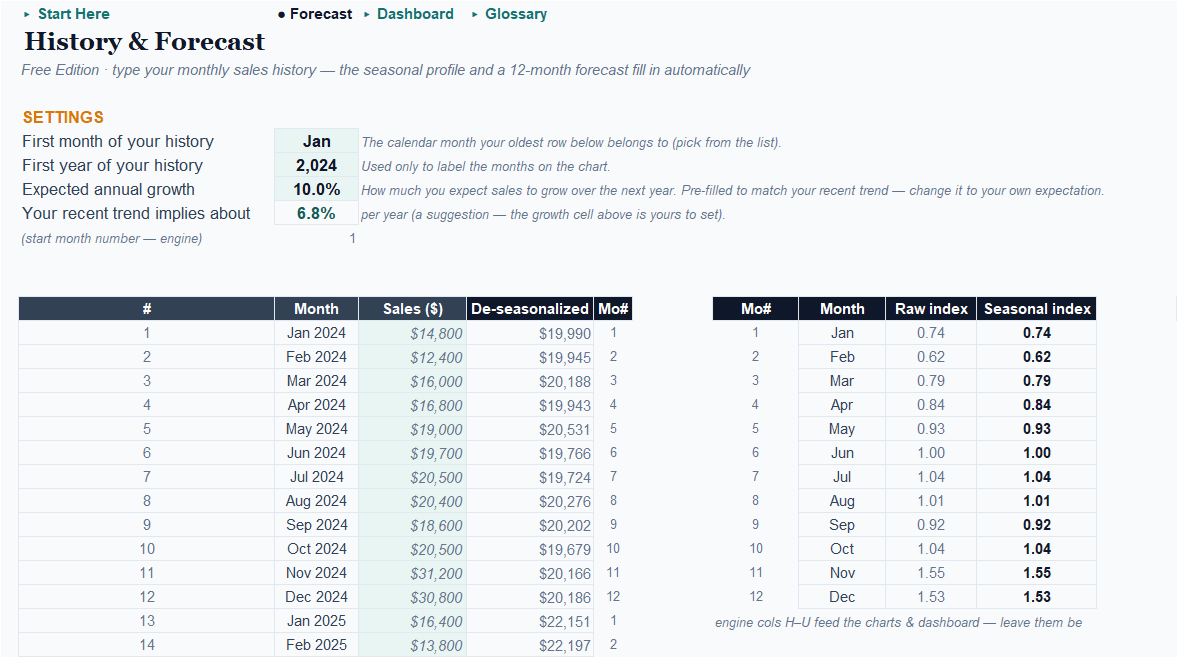
A free seasonal sales forecast template: paste 12–24 months of history and get a forward 12-month forecast shaped by your real peaks and troughs — with your seasonal profile drawn out so you can see it. Excel and Google Sheets. No macros.
Free. Email required so we can send the file. No spam — you can unsubscribe anytime.
“Last year plus 10%” isn’t a forecast — it’s a guess wearing a spreadsheet. It plans the same inventory for November and February — short at the peak, overstocked through the trough. Your history already knows your seasons; most templates just never ask it.
What the free seasonal sales forecast template shows you
Your seasonal profile, from your own history
Each month indexed against your average (1.50 = a month that runs 50% hot), computed from your own history — which months run above and below, and by how much.
A forward 12-month forecast — not last year plus 10%
Trend × season × a growth rate you control, pre-filled from your own trajectory.
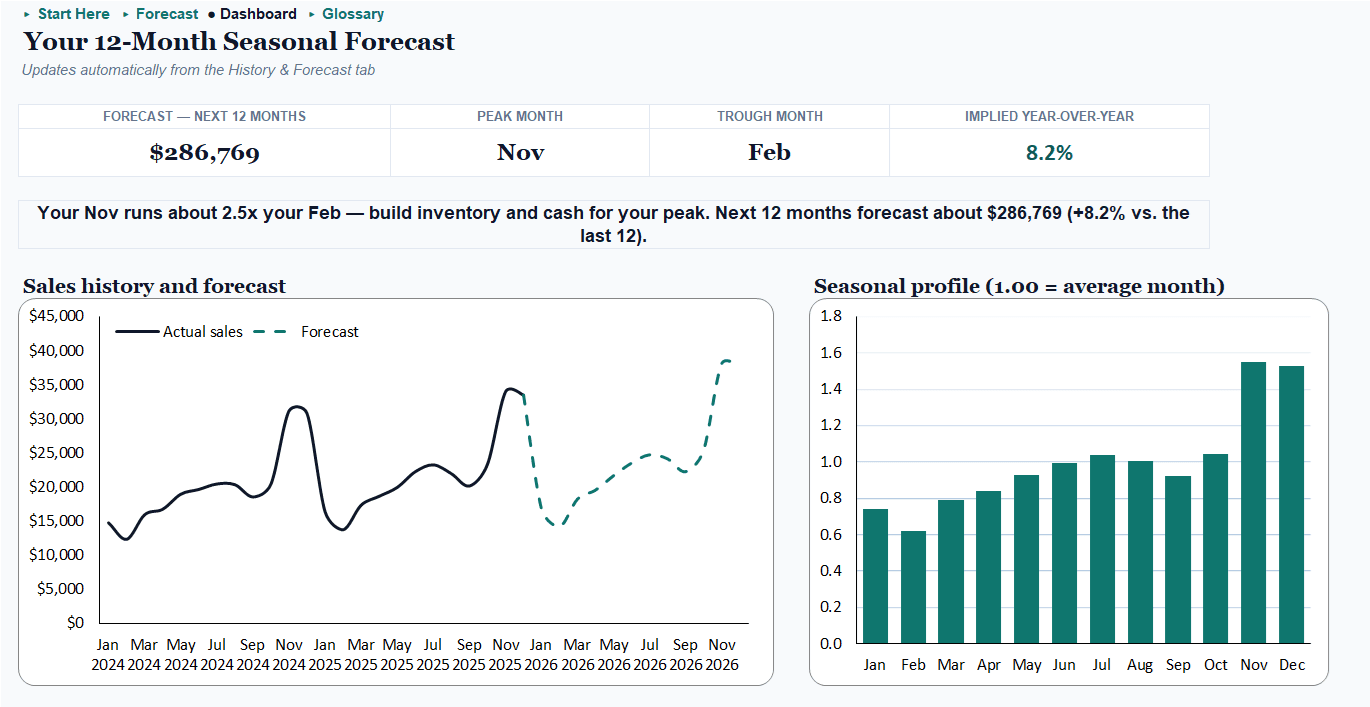
Peak month, trough month, and what to build for
The plain-English read: your peak month, your trough month, the implied year-over-year, and one signal line telling you what to prepare for.
Works in Excel and Google Sheets (no macros)
No macros, nothing to enable — the same file runs in Excel and Google Sheets. Three steps from pasted history to a forward forecast:
1
Set your first history month, then type monthly sales — oldest at the top, 12–24 months (24 reads the seasons best).
2
Accept the pre-filled growth rate or type your own expectation.
3
Read the Dashboard: the history-plus-forecast chart, your seasonal profile, and the signal.
See it in action: the seasonal retailer example
The workbook ships pre-filled with a fictional seasonal specialty retailer with a strong Q4 — these are its actual dashboard numbers. Open it, see your shape, then type over the example with your own months.
Free vs. Pro: the rolling forecast that proves itself
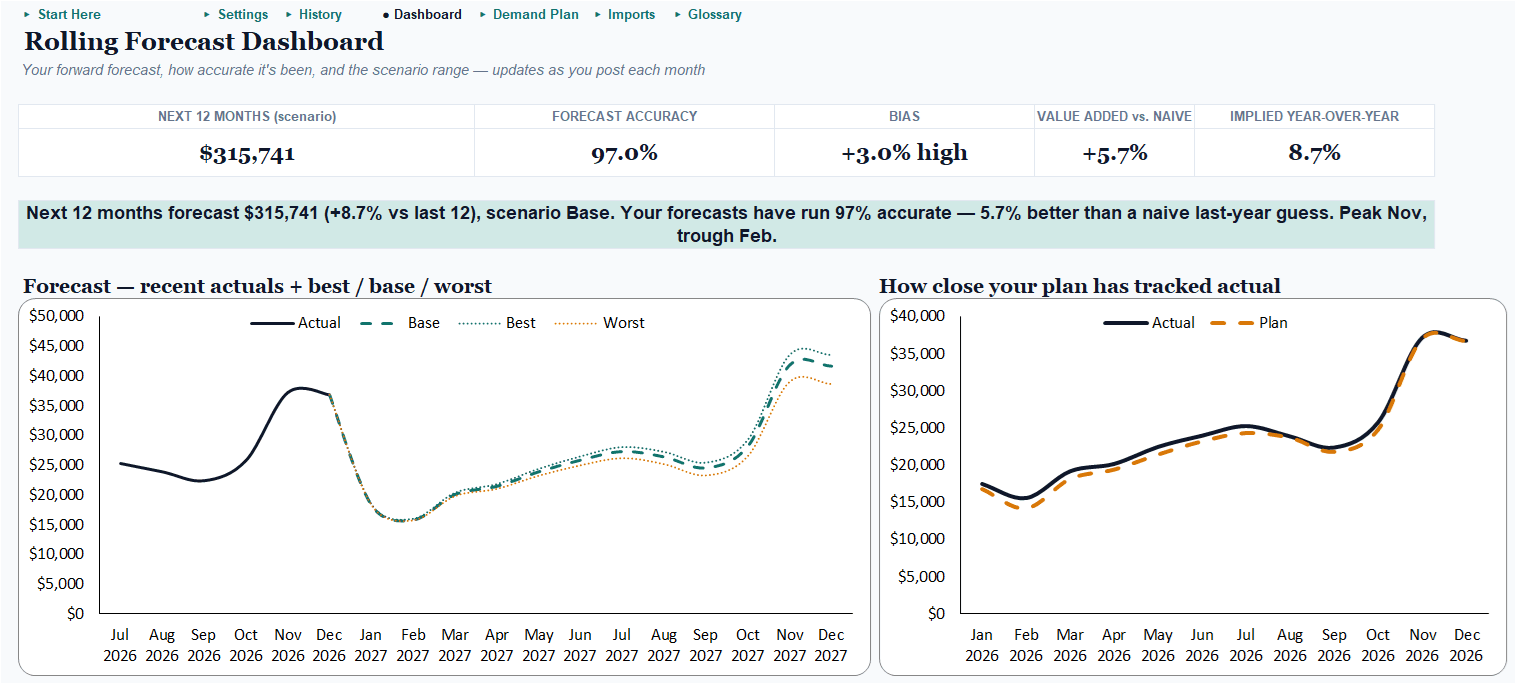
Free shows you the shape of your year. Pro keeps the forecast alive — and proves it’s earning its keep.
| Free — 12-Month Seasonal Forecast | Pro — Rolling, Plan-vs-Actual | |
|---|---|---|
| Price | Free (email) | $39 one-time |
| Platform | Excel and Google Sheets | Excel only (macros) |
| Seasonal profile from your history | ✓ | ✓ |
| Forward 12-month forecast (trend × season × growth) | ✓ | ✓ rolling — actuals advance it automatically |
| Peak / trough / year-over-year + signal | ✓ | ✓ |
| Plan-vs-actual + accuracy + miss direction | — | ✓ against pre-locked plans |
| Proof vs. a naive last-year guess | — | ✓ (+5.7 pts in the sample) |
| Best / base / worst scenario fan | — | ✓ |
| Multiple streams (channels/categories) | — | ✓ roll up to a total |
| Import & aggregate (Shopify, Amazon, Square, Etsy, QuickBooks) | — | ✓ to clean months |
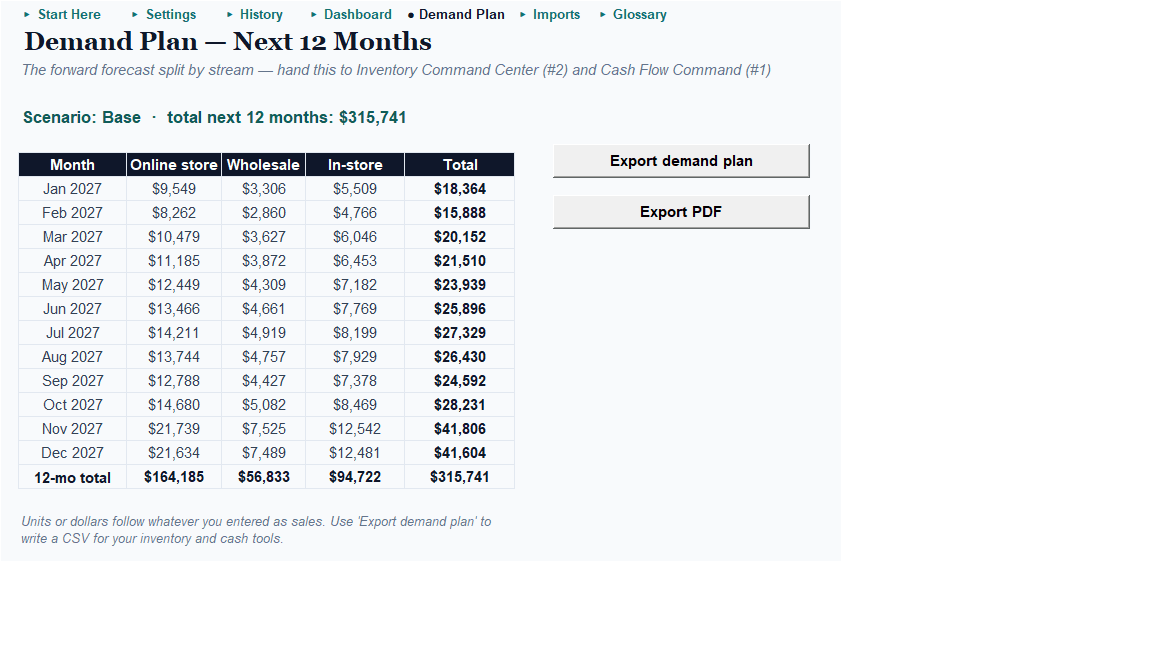
| Demand Plan export → Inventory Command Center + Cash Flow Command | — | ✓ CSV, one click |
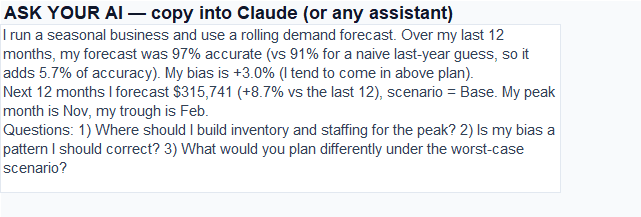
| Paste-into-Claude AI commentary | — | ✓ (+ no-AI fallback) |
Free reads your seasons. Pro runs your year.
A forecast you make once is a snapshot. This one rolls.
Pro posts each month’s actuals and rolls the horizon forward automatically — always 12 months of forward view. It tracks how close your forecasts have been and which direction you consistently miss, measured only against plans locked before the month happened — no grading its own homework. It proves the model beats a naive last-year guess: in the shipped sample the forecast runs ≈97% accurate, 5.7 points better than naive. Best/base/worst scenarios on one fan chart, streams that roll up to a total, imports that aggregate your Shopify, Amazon, Square, Etsy, or QuickBooks exports to clean months, and a Demand Plan export built to drop into the Inventory Command Center and Cash Flow Command. Excel, one-time purchase.
The planning chain: forecast → inventory → cash
Your forecast is the front of a chain — it tells the Inventory Command Center what to buy and Cash Flow Command what’s coming. Pro’s Demand Plan export is built to drop straight into both.
Inventory Command Center →
The demand plan becomes the sales-rate inputs behind your reorder points — what to buy, how much, and when.
Cash Flow Command →
The forecast feeds the cash-in line of the 13-week cash forecast — so the cash plan sees the peak coming.
Get the free forecaster
Enter your email and we’ll send the download link — plus occasional useful tips. Unsubscribe anytime.
We'll email the download link. No spam — unsubscribe anytime.
Every engagement comes with a number — the free tools included. Want a second set of eyes on your plan? Start with a free assessment →
Frequently asked questions
Is it really free?
Yes — the 12-Month Seasonal Forecast is a free download; we ask for your email so we can send the file and occasional useful tips. Unsubscribe anytime.
Do I need Excel, or does Google Sheets work?
Either. The free edition uses no macros — upload it to Drive and open with Google Sheets; the charts and formulas carry over.
How much history do I need?
Twelve months minimum for a seasonal read; twenty-four is better — two of each calendar month makes the profile much stronger. Fewer than twelve still runs, with a warning.
How is this different from “last year plus 10%”?
It separates your seasonal shape from your underlying trend, so each month is forecast against its own character — your November like a November, your February like a February — with growth applied on top as a lever you control.
What does Pro add?
A rolling forecast that advances itself as actuals land, an accuracy and miss-direction record measured against pre-locked plans, proof the model beats a naive last-year guess, scenarios, multi-stream roll-ups, import-and-aggregate from your platform exports, and a Demand Plan export for the Inventory Command Center and Cash Flow Command. One-time $39.
Are the forecasts guaranteed?
No forecast is — this one is honest about it. Accuracy is tracked against plans locked before each month happened, and the growth assumption stays visible and yours. In the shipped sample the model runs about 97% accurate and beats the naive guess by 5.7 points.
Let’s find your number.
Start with the free forecaster — or tell me what you’re working on, and we’ll find the one metric worth moving first.